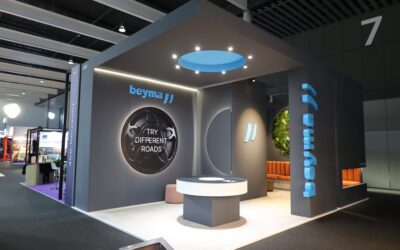
Creating a trade show booth that captivates and engages visitors requires more than stunning visuals or clever messaging. You can’t just slap on some shiny graphics, toss in a free pen, and hope for the best.
It demands a strategic blend of data insights, behavioral science, and smart design choices. When done right, your booth not only attracts attendees but also keeps them engaged in meaningful ways.
This week, we teamed up with Courtenay Worcester, Head of Analytics at FastSensor, to explore how exhibitors can optimize booth traffic flow by pairing cutting-edge technology with psychology-backed design principles.
In-Booth Tracking Technology: The Game-Changer for Exhibitors
Relying on a single metric to evaluate event success — like badge scans, exit surveys or giveaway items distributed — is like trying to understand a painting by only examining one corner. While these measurements are useful, they often miss the full story. Attendee engagement technology has flipped the script on how exhibitors measure success. This technology delivers a comprehensive view, enabling you to analyze visitor behavior with the precision of a NASA mission control room.
These systems use sensors to collect anonymous data from attendees’ devices, like smartphones or smartwatches, and analyze their movement, dwell time, and engagement. The result? A goldmine of actionable insights.
Take FastSensor, for instance. It’s like having an undercover analytics team quietly working in the background, tracking everything from how many people stopped by to how long they spent at specific displays.
FastSensor is like having an extension of your team. It discretely places sensors around activation sites to measure attendee engagement. It tracks behaviors from attendees cutting the corner of the booth, visitors displaying intent or qualified interest to deep engagement and booth exploration. This unbiased approach allows exhibitors to extract what went well, identify areas for improvement, and make impactful design adjustments for future shows.
What Makes Attendee Engagement Tracking Essential?
- Objective, Unbiased Data: Attendee engagement tracking cuts through the noise of anecdotal feedback and overly enthusiastic (or pessimistic) team reports. It captures data without bias, ensuring you get the unvarnished truth about your booth’s performance.
- Real-Time Insights: Why wait until the show’s over to realize your product demo station was in the exhibit equivalent of the Bermuda Triangle? Tools like FastSensor provide real-time insights so you can make mid-show adjustments.
- Actionable Metrics: In-booth tracking focuses on key metrics such as:
-
- Awareness: Did attendees even notice your booth, or were they distracted by the popcorn machine three aisles over?
- Conversion: How attendees stepped in the booth and explored your displays?
- Attraction: Which areas are drawing the most attention?
- Journey: Did attendees explore your booth thoroughly or head for the exit like they were dodging a bad first date?
By measuring these metrics, exhibitors can identify what’s working and refine what’s not — either during the event or in preparation for the next one.
From Heatmaps to High-Value Prospects: Using Data to Drive Engagement
Real-time data can transform a good booth into a great one with just a few strategic tweaks. For instance, one exhibitor noticed sparse foot traffic around a demo station. A simple 45-degree repositioning improved its visibility and engagement dramatically. Heatmaps also reveal bottlenecks or overlooked areas, like a booth’s perimeter where visitors may linger without exploring further. Rearranging seating to open up access to the center encourages deeper exploration and interaction.
It’s not just about fixing bottlenecks — it’s about strategically placing engagement points. Hospitality, for example, is a reliable crowd-pleaser — but where it’s placed matters. A counter near the booth’s edge may lead to grab-and-go behavior, while a centrally located counter invites visitors inside. Positioning interactive displays or seating near hospitality areas ensures attendees stay engaged rather than just snacking and leaving.
FastSensor takes this a step further with metrics like FastSensor Qualified Visitors (FQVs), segmenting attendees into Browsers and Engagers. By tracking their journeys and behaviors, exhibitors can focus efforts on high-value prospects, strategically placing content and interaction points to maximize meaningful connections and conversions. Whether it’s repositioning a demo, rethinking hospitality, or targeting high-value personas, these small adjustments can make a big difference in booth performance.
Design Mistakes to Avoid

Even the best data tools won’t save a booth design that shoots itself in the foot. Here are some common mistakes — and how to avoid them:
- Dead-End Layouts
Dead-ends are great for suspense thrillers, not trade show booths. They frustrate visitors and create traffic bottlenecks.
Fix: Open up pathways and include multiple exits (especially at the rear of the booth) to encourage free movement. Think flow, not roadblock.
- The ‘Fort Knox’ Entrance
Overstaffing or creating an overly controlled entry can intimidate visitors. No one wants to feel like they’re walking into a customs checkpoint.
Fix: Use welcoming signage and spread staff across the booth to foster organic, non-pressured interactions.
- Cluttered Chaos
A booth that tries to do too much ends up doing nothing at all. Cognitive overload leads to disengagement faster than you can say “free tote bag.”
Fix: Simplify your design by highlighting key attractions and providing clear navigation.
- Hidden Content
Enclosed areas or displays hidden behind walls scream “Enter if you dare!” Visitors won’t.
Fix: Use open layouts or transparent panels to make content easily accessible.
- Ignoring Real-Time Feedback
Data is your friend — if you use it. Ignoring live insights means missed opportunities to improve during the show.
Fix: Monitor heatmaps and engagement metrics to make on-the-spot adjustments.
Want to learn about the Behavioral Science that can guide design, check out “The Art & Science of an Irresistible Booth.”
Post-Event Insights: Turning Data into Long-Term Success
The real magic happens after the show, during the post-event analysis phase. This is where exhibitors transition from simply reviewing what happened to uncovering why it happened — and how to make the next event even better.
Step 1: Define Clear Objectives
Before diving into the data, it’s essential to revisit your original objectives. Were you aiming to attract more qualified visitors, boost engagement, or improve overall visitor flow? Without a clear set of goals, even the best insights can feel like a collection of numbers without a purpose.
Step 2: Measure Outcomes with FastSensor
Tracking technology helps you accurately map your booth’s performance relative to these business objectives. By analyzing attendee movement, dwell time, and engagement patterns, you gain a detailed picture of how your booth performed in each key area.
Step 3: Leverage the Engagement and Attraction Matrix

The Engagement and Attraction Matrix is a game-changer for exhibitors. By plotting every activation or event on the matrix, you can visualize booth performance across two critical dimensions:
- Attraction: How well did your booth draw attendees and convert them into qualified visitors?
- Engagement: Once inside, how effectively did your booth maintain visitor interest and encourage deeper interactions?
The matrix categorizes booths into four performance quadrants:
- High Performing Booths: Strong in both attraction and engagement—a sign of a well-designed, highly effective booth.
- Attractive Booths: Great at pulling people in but struggles to keep them engaged.
- Captive Booths: Engages deeply with visitors who enter but struggles to draw a crowd.
- Low Performing Booths: Lacking both attraction and engagement—time for a strategic overhaul.
Step 4: Create a Data-Driven Roadmap to Improvement
No matter where your booth falls on the matrix, it’s not the end of the story. In fact, it’s just the beginning. The combination of Attraction and Engagement scores provides a clear starting point for improvement.
- For Attractive Booths: Add interactive displays, improve staff training, or develop content that holds attendees’ attention longer.
- For Captive Booths: Focus on outward visibility—consider bold signage, better lighting, or an open layout to draw more attendees in.
- For Low Performing Booths: Use insights to completely reimagine the booth’s layout, design, and messaging.
The matrix eliminates the guesswork. Instead of wondering where to start, you’re guided by the data, making your adjustments strategic and impactful.
The Matrix is a roadmap for improvement. It helps you pinpoint exactly what needs to change and how to move closer to that high-performing sweet spot.
Final Takeaway: Measure What Matters
Many exhibitors fall into the trap of adapting metrics to fit their booth’s activities, creating a feel-good story that often misses the mark. Sure, counting how many tote bags you handed out might look great on paper, but does it really tell you if your booth delivered meaningful engagement or drove qualified leads? Probably not.
Surface-level metrics, like the number of giveaway items distributed, may suggest high attraction but fail to reveal whether visitors engaged deeply with your displays or connected with your staff. This distorted view can lead to misaligned strategies, with exhibitors doubling down on tactics that look successful yet deliver little actual value.
Here’s the truth: Accurate, data-driven measurement is the only way to truly understand your booth’s performance. By focusing on real visitor behavior — like traffic flow, engagement depth, and underperforming zones—you can identify what’s working, what’s not, and where to make impactful changes.
Tracking tools, like FastSensor’s technology, ensure you’re not just guessing but basing decisions on actionable insights. With this approach, every event becomes an opportunity for continuous improvement, helping you align your booth strategy with broader business goals and achieve measurable success.
So, stop settling for surface-level wins. Dig deeper, measure smarter, and let the data guide you to a booth that truly performs.
Ready to level up your trade show game? Subscribe to the One Thing newsletter for more insights like these.

Don’t leave your booth’s success to chance. FastSensor’s cutting-edge analytics can help you uncover hidden opportunities, optimize your design, and turn visitors into engaged participants. Ready to make data-driven decisions that deliver real results?
Visit FastSensor today to learn how their tools can take your trade show performance to the next level!


